Alternative title: Finding string value from a dimension with highest numeric value

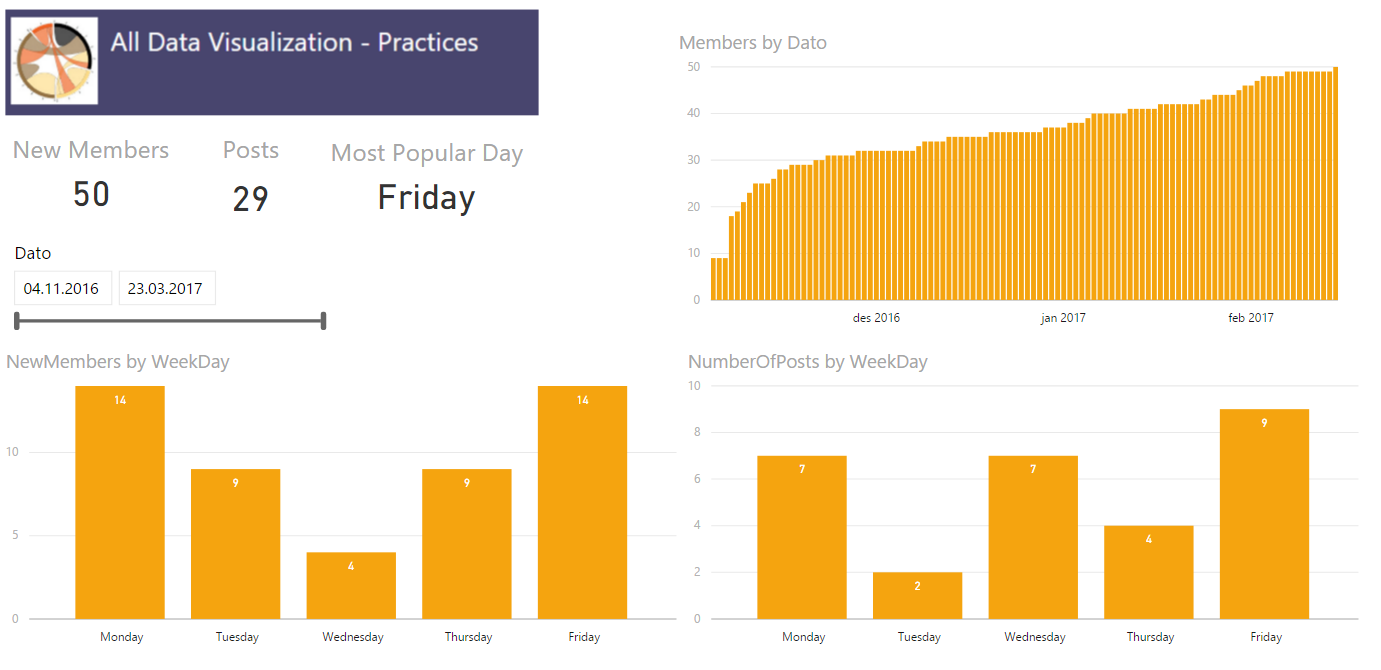
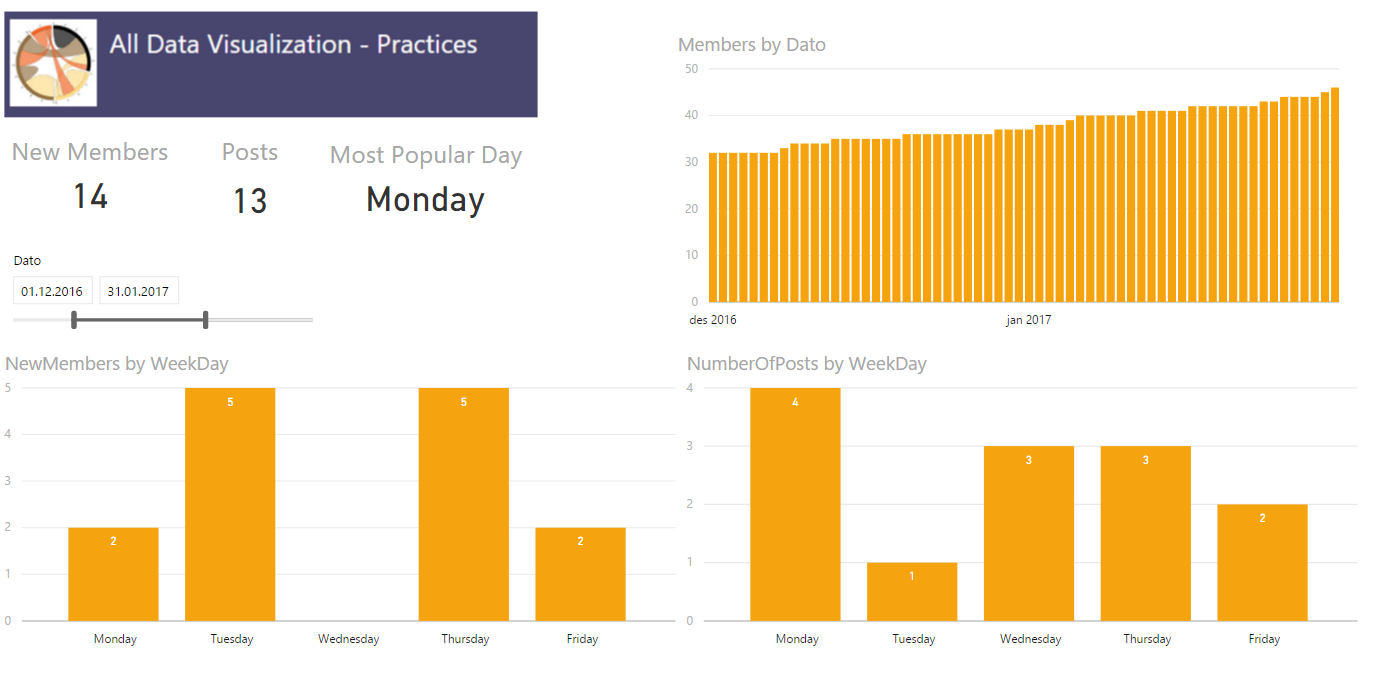
The company i work for uses Yammer and I have founded a Data Visualization group which I am, manually, keeping some statistics about using Power BI. The other day I found myself wanting a dynamic card in Power BI in order to highlight which day was the most active when it came to amount of posts. In order to do this I had to figure out how to make a measure returning not the max value, but the day which had the maximum amount of posts. My usecase is finding a weekday, but maybe you want to see which product is the most popular, which county has the most purchases or which salesperson has the most sales. All these cases should be able to reuse this measure.
First try
My inital thought was to create a table in my calculation and then slice it to return only one row and one column leaving me with one cell which had the day with the most number of posts. I made a measure which used a TOPN returning the row with most posts followed by a SELECTCOLUMN to select only the column which had the weekday in it. Now, this turned out to return me the overall correct day, but it did not work when I added a filter and the POwer BI visualization returned errors so I had to start over.
The solution
I have created three measures to solve this.
1) One simple sum of [Number of Posts]:
Number of Posts = SUM(Sheet1[NumberOfPosts])
2) Finding the day with the most posts by using MAXX
MaxPostsPerWeekDay = MAXX(VALUES(Sheet1[WeekDay]);[Number of Posts])
3) Using FIRSTNONBLANK on my WeekDay column and then return the value where the sum equals the maximum value. So in the end my measure looks like this.
Most Popular Day =
IF(
    ISBLANK([Number of Posts]);
    BLANK();
    FIRSTNONBLANK(
        Sheet1[WeekDay];
        IF(
            [Number of Posts] =
            CALCULATE(
                [MaxPostsPerWeekDay];
                VALUES(Sheet1[WeekDay])
            );
            1;
            BLANK()
        )
    )
)

The first IF is to remove days that has no posts, in my case there is not much activity in the weekends so they will get filtered out. The beauty of this measure is that it is not limited to crads, but also easy to use with your filters and in tables where you would want it.

Is it possible to create more detailed commentary boxes that interact with slicers in power BI? so for instance i could select a sales provider from the Slicer and this would automatically bring in several lines of text unique to that organisation