Tag Archives: Business Intelligence

Compare Sales With Last Year on Day in Week in Power BI

A very normal calculation we do is to compare a value, for example sales, against how we did last year. The easiest way to do this is by using the SAMEPERIODLASTYEAR function to create a measure that look like this

Sales LY = 
CALCULATE(
 [Sales]
 ;SAMEPERIODLASTYEAR(DimDate[Date])
)
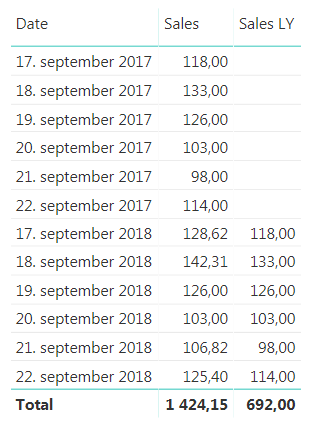
Sales compared to Last Year on given dates

As shown in the image above this works fine for a given date, but what if we want to look at how one week compared to last year? For retailers this is a very normal demand. ow can we compare monday in one week to monday in the same week last year? After all it is a big difference in how much sales is being done on a Saturday compared to a Sunday, the shop might even be closed on sunday. For this we need to create a calculated column to help us out. We are going to call it DWY (for DayWeekYear) and we can do it like this

DWY = WEEKDAY(DimDate[Date])*1000000 
+ WEEKNUM(DimDate[Date])*10000 
+ YEAR(DimDate[Date])

Note: For people not using American calender you may need to prep week number  otherwise to get ISO week, for example in your date dimension. Then you can do the calculation. The important part is that is lines up with your definition of day in week, week number and year.
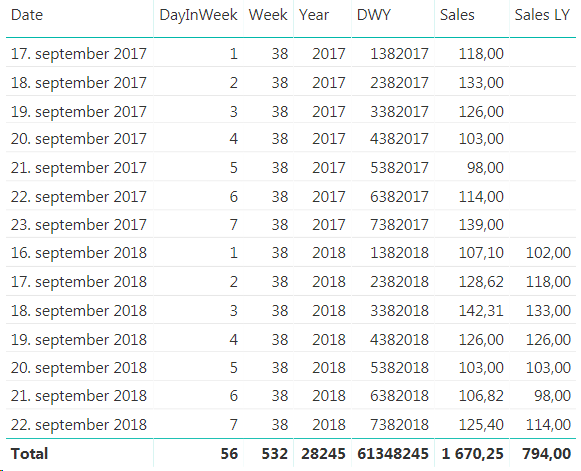
Sales for given dates with the new DWY column

Here you can see that 17th of September 2017 is a Monday, but in 2018 it is a Tuesday so we are unable to compare the two. Now, the beauty here with our new DWY column is that if we subtract one from a DWY date this year we get the same day in the same week last year. So, DWY Last Year = DWY -1. Which is great! So we can use this to create a measure that compares day in week vs the same day in week last year.

Sales LY Week =
Calculate
(
 [Sales]
 ;Filter(ALL(DimDate); DimDate[DWY] = Max( DimDate[DWY])-1)
)
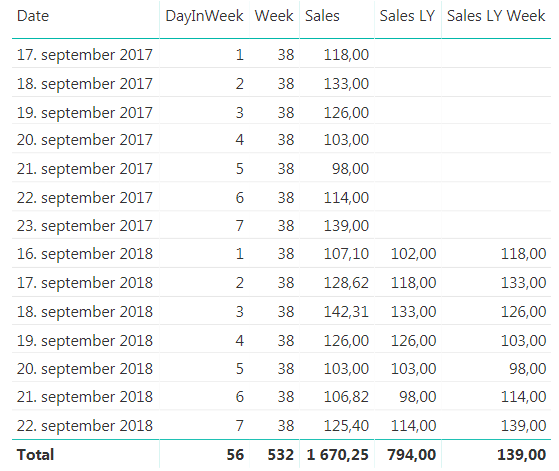
Compare sales on day in week to last year

This works great when we look at a specific date, but you will see that the total row for the new measure is the same as the last value, and not the sum, so we have to extend it a little bit to make it sum up all the days we are showing. To do this we will use the SUMX function to create this measure

Sales LY Week Total =
SUMX
(
 VALUES(DimDate[DWY])
 ;FactSales[Sales LY Week]
)
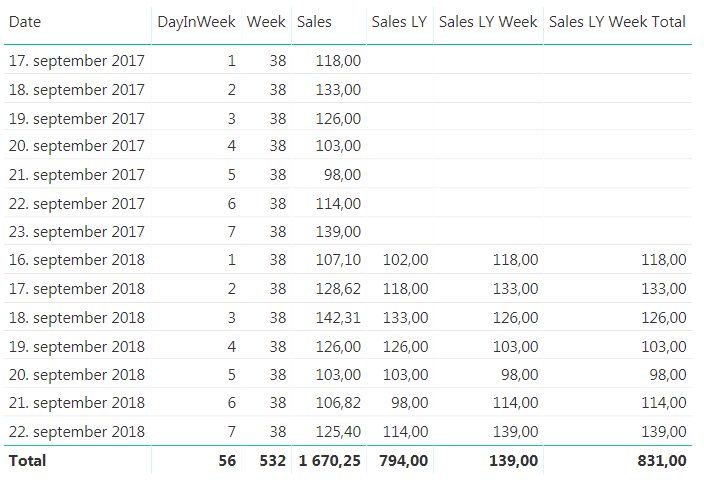
Finished measure to compare day in week vs last years day in week

There you have it. But can we do more? In general I don’t like having more than one measure saying the same thing. We are looking at sales for last year in both measures we have created, it is just that one is comparing with a specific date and one is comparing with day in week. I would like to just have one measure that is Sales Last Year and then we can say that if the user is filtering on a week or a weekday we will show them the day in week last year value and otherwise we will show them the specific date. Now, this might be on a case to case scenario, but if you keep both measures available to they users they will have to remember that they cannot use the Sales LY Week Total measure if they want to look at a specific date, they have to use the “normal” Sales LY measure. In my experience this is often a source for user errors that might be confusing so we can hide this complexity by combining the measure we have created.

Sales LY Total =
IF
(
 ISFILTERED(DimDate[Week]) || ISFILTERED(DimDate[DayInWeek])
 ;FactSales[Sales LY Week Total]
 ;FactSales[Sales LY]
)

The finished result will behave as shown below. The same measure is used in both tables, but the one on the left is filtered on week while the one on the right is filtered by dates. If you have more ways of showing week or week day in your date dimension, like the week day name remember to include them in the IF statement to make them work as we want them to.
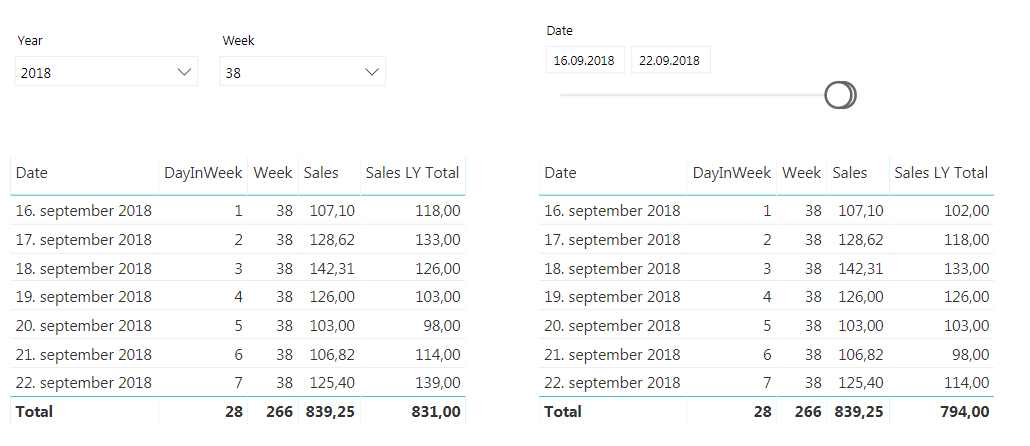
Sales filtered by Week (left) and dates (right)

Smart data? Or Smart People?

A while  back Stephen Few argued that data can not be described as being beautiful. At that point in time I did not agree to this statement. I do think data can be beautiful, but as the term “smart data” is popping up more and more I find myself unable to use this term to describe data. Am I being a hypocrite? Can data be beautiful, but not smart?

To me data is one of the dumbest things out there, it just exists. Data on it’s own creates absolutely nothing, it wouldn’t even have existed if someone didn’t create it. So even though I find myself saying that data can be beautiful I don’t like the term smart data. Data can be structured, organized and formatted beautifully, but being smart? No!

By stating that data is smart we take away the credit from many people who works with data each day. Smart people, really smart people! They are the ones that deserves the credit for all the amazing things data can be used for, not the data itself. Do we call trees smart just because we can do amazing things with them? No, but the inventors of paper, housing and so on they were geniuses!

Give credit where credit is due. Data is lazy, it would lie on the couch all day if it could. The people that works with data on the other hand and gets the data up from the couch and creates amazing products and services with it, they do all the dirty work and should also get all the glory!

The Little of Power BI Visualization Design – Part 2

Continuing our journey on applying Andy Kirks tips and tricks from his series “The Little of Visualization Design” we are now at part 2, Clever Axis Scaling. As last time I suggest you read his post first so we already have some common ground.

Why use clever axis scaling

Clever axis scaling is a tool in order to create some drama in your visualization. It can also help you highlight values and draw your consumers eye towards it. Things that stand out will get attention, our brain is simple in this regard, and in this case that is what we are after.

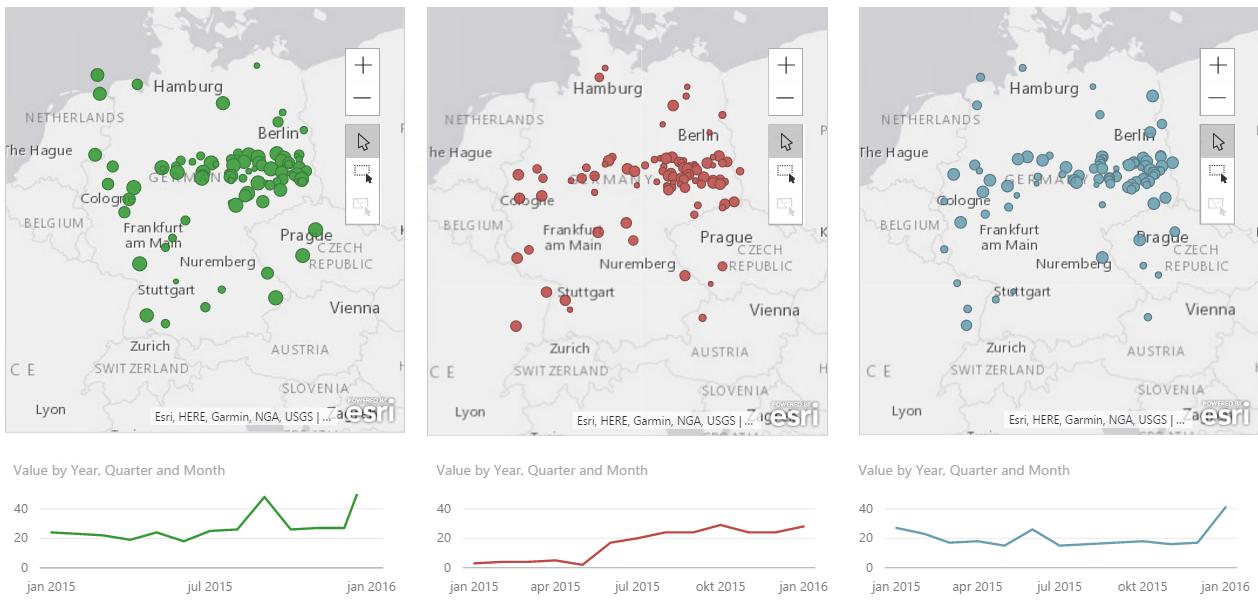
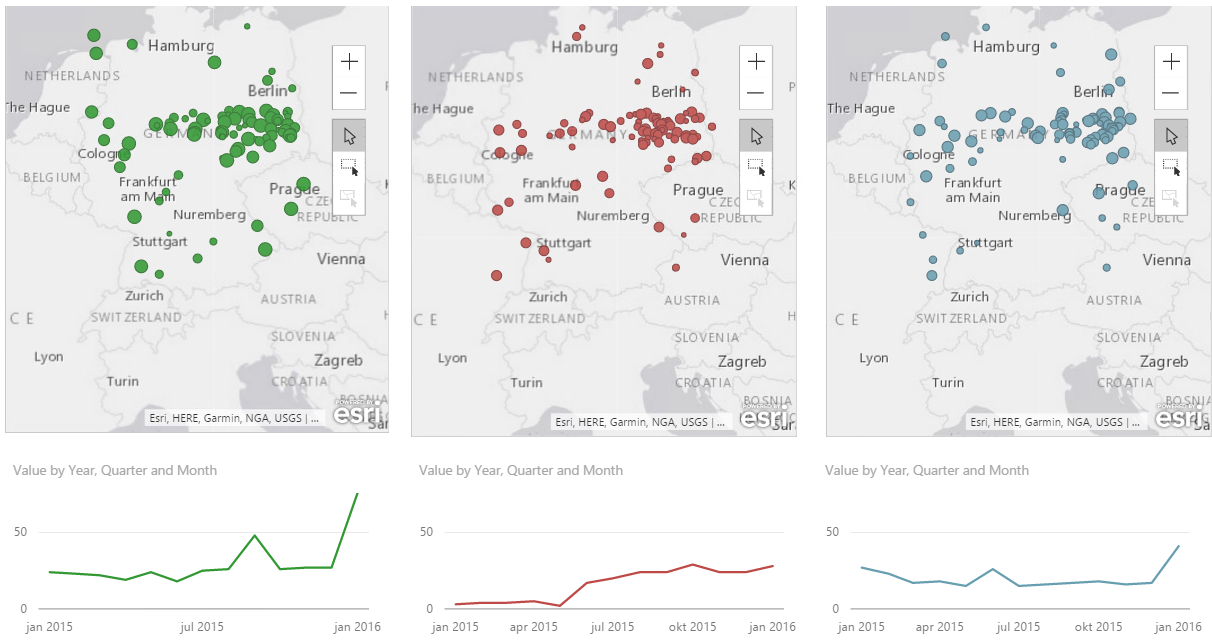
In the example the y-axis is set to 50, but the maximum value is 76. Now, my quick thought was “Great! this is easy, lets just set the y-axis to 50 so the helper line is 50”. This is easy to do, however the chart actually gets cut at 50. So it ends up looking the image below, which is not what we want at all. We are now hiding the most interesting data!

Max y-axis value set to 50 truncates your graph

So I tried setting it to 100. Now, that works okay, but the highest line on the y-axis is now not 50 so the dramatic effect of 76 shooting way above the last helper line on the y-axis disappears even though we still see the biggest increase on the chart to the left. So what is the solution? You need to try out what works best with your data. In this case it seems to work fine to choose 76, the maximum value in the chart. Now this will not always be the case because we can not control how many lines on the y-axis we get. If I make the chart higher you can see that the y-axis changes with numbers as well.

Trying out different max values on the Y-axis
Different heights can remove some of the effect we are after

Use it carefully

This solution also has the drawback that you are hardcoding the minimum and maximum value. So if you suddenly have a value higher than 76 you will loose it! In the end it comes down to what you want to tell with your chart, if your chart is going to change values often and how dramatic you want it. If you have no idea how your numbers will behave in the future I will not advice you to hard code min/max values unless you need it for a specific occation like a presentation. When you are done with that spesific occasion I suggest you turn them back to automatic to minimize confusion.

Final result

As with all tools PowerBI has some limitations compared to custom code and for example using something like D3.js where you can do absolutely everything you want! Having these limitation can make it a challenge to use all these tips and tricks  going forward, but we will do the best we can! In this case we might have some problems trying to create a more dramatic effect in our storytelling. Both with your axis’ as we have seen here, but also with data labeling as PowerBI does not let you choose which data points to highlight. So if you try to label the highest value without hovering over it it is not possible. Or at least I didn’t manage to, but if you do please let me know how you did it.

Also, if anyone has a way of hiding the ESRI logo in Power BI Desktop please let me know. They are not pretty and are driving me crazy!

Part 1: Real time dashboard using a Raspberry PI and Power BI

Part 1: Setting up Azure Active Directory and registering your application

When the Power BI preview finally was released I was really intrigued by the Power BI API which among other things allow you to create dashboards that are updated in real time. Now, I am expecting my first child in under a month now and I thought that why not combine my background in cybernetics and embedded systems with my present, business intelligence. I have bought a Raspberry PI and I invite you to join my mission to hopefully create a baby sound monitor that will be updating a Power BI dashboard in real time to show how often, how loud and how long my baby is crying. Hopefully we will have a quiet baby that never screams and I’ll have to use this for registering baby laughter instead, but who knows right? You might not have a baby on its way, but maybe you have some other IoT project you want to do or just want to try out the Power BI API. Either way you’re invited to embark on this journey together with me!

I will make this into a series of post, but the journey starts with setting up your Azure Active Directory and getting to know the Power BI preview where a dashboard will get updated real time using the Power BI API later. In order to use the Power BI API you need to register the application you will be making in your Azure Active Directory. I also made a new user that I am going to use for my Power BI site.

Creating an Azure Active Directory

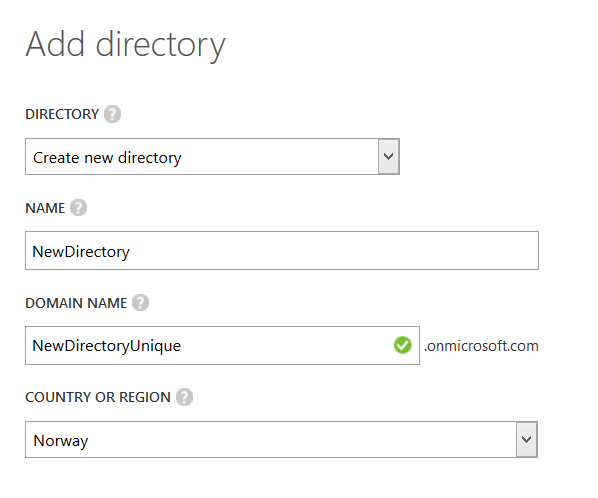
When you log into your Azure Management Portal you will find Active Directory on the navigation bar on the left. Click on Active Directory and the new button, choose App Services, Directory and click on Custom Create to create a new AD. Give it a name, a domain name and select the country for your directory. The country can’t be changed after the directory is made and affects which data center your AD will be located in so choose wisely, or just go with the country you’re in as I did.

NewAD
AddDirectory

When your directory is created it will show up under your Azure Active Directories. I have made a new user that I am going to use with Power BI and then signed up for a preview over at www.powerBI.com using this user from my Azure Active Directory. It might take some time to get a Power BI provision up for your Azure Active Directory  organization so I would do this step before you read the rest of this post.

Registering your Power BI app

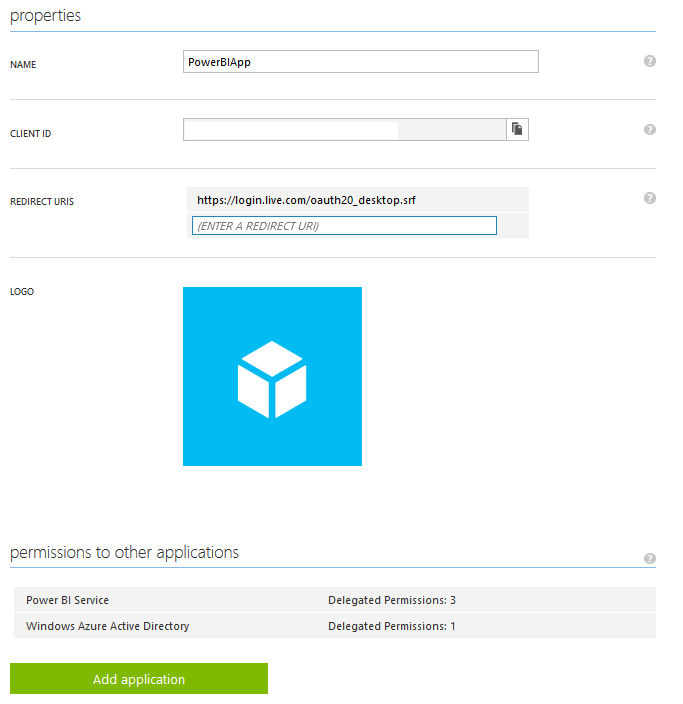
Before you can create your Power BI application you need to register your app in your Azure Active Directory. Click on the directory you created, go to applications and press add. You want to “add an application my organization is currently developing” and you want it to be a “native client application”. You are asked for a redirect URI where you can use https://login.live.com/oauth20_desktop.srf. Make sure when you start writing your program to use the same redirect URI in your code.

When your application is up you need to set some permissions for it. Click on your application, go to configure, scroll to the bottom of the page and press Add Application. Select “Power BI Service” and close the window. Power BI Service will show up under “Permissions to other applications”, but before you are done you have to check all three checkboxes in the dropdown “Delegated Permissions”.

PowerBIPermissions
PowerBIPermissions2

And with that step: Congratulations! You are now ready to copy/paste the Client ID from your application and start using it together with the Power BI API. We will continue on that later. Feel free to play with the Power BI preview as well to familiarize yourself by f.ex uploading an Excel file as a data source and make some reports and dashboards. Personally I am looking forward to having more visualizations as I almost felt the word preview should have been emphasized more in this Power BI preview.

PowerBIProperties
Other parts of the series can be found here:

Part 2: Real time dashboard using a Raspberry PI and Power BI